Unprecedented growth, but for whose benefit?
ELIZABETH CULLEN
For the politicians who claimed to have bred it, the Celtic Tiger was a matter of great pride. After all, it had been hailed as 'one of the most remarkable economic transformations of recent times' by The Economist magazine. 'Mr. President,' the Taoiseach, Bertie Ahern, boasted 1 to President Clinton and members of the Oireachtas during the American leader's visit to Ireland in 2000, 'in the eight years of your presidency, Ireland has changed, and changed very fast. We've a new economy and a modern society. The economy is now in its seventh year of sustained growth. It has grown by over 9 percent per annum in the last three years.'
Certainly, the pace of Irish economic growth had been remarkable. As figure 1 shows, in just thirteen years, between 1989 and 2002, the population's average income had doubled, which meant that it had grown by as much as it had increased in all the 8,000-odd years since the first settlers moved into the country as the ice sheets retreated.2
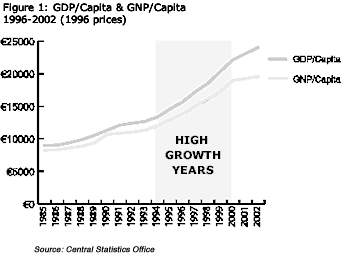 |
Irish incomes double Figure 1: Gross Domestic Product (GDP) measures the value of all the goods and services produced in a country in the course of a year, whereas Gross National Product is the value of the goods and services the inhabitants of the country actually consume. The growing gap between the two shown above is largely due to the fact that the profits made by foreign companies based in Ireland are included in GDP but not GNP and that these have increased more rapidly than other incomes. Nevertheless, the value at 1995 prices of the goods and services available to the average Irish resident (the lower line above) doubled between 1989 and 2002. Most of that growth took place between 1994 and 2000, the shaded area on the graph. |
This rate of growth was at least three times faster than in comparable countries. To achieve it, the way people lived and earned their incomes had had to change significantly. Many more people were going out to work than before and unemployment, which began to fall in 1993, dropped from almost 16% to just under 4% in 2001, as depicted in figure 2. It has risen slightly since.
By 2003 Ireland had become the world's 'most globalised' country thanks to its high level of foreign trade, multinational investment and the large number of telephone calls to the rest of the world3 . The Central Statistics Office's Statistical Yearbook of Ireland 2003 reported that manufacturing industry production more than doubled between 1995 and 2002 and the output of the distribution, transport and communications sectors expanded by almost as much during the same period. By contrast, the traditional base of the economy, agriculture, forestry and fishing, only grew by 7% during those years.
Dramatic fall in unemployment
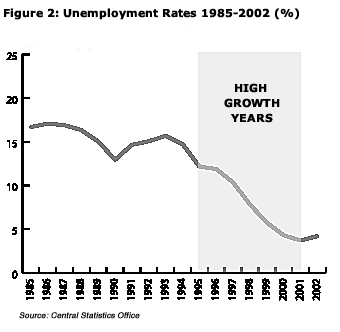 |
Figure 2: The percentage of people unemployed fell sharply in the high growth period between 1994 and 2000, and then began to rise a little once the growth rate slowed. The fall was perhaps the major benefit of the Celtic Tiger years but many of the jobs created were poorly paid. |
The beneficial effects of the reduction in unemployment must not be underestimated. Many studies have found that unemployed people consistently show higher levels of psychological distress than employed people living on the same level of income. There is also a lot of evidence that unemployment is associated with increased illness and mortality. However, it may have been that other changes during the period offset much or all of the benefit of reduced unemployment, particularly as many of the jobs created were poorly paid. We will be discussing some of these changes in this article.
Apart from the lower unemployment, what benefits did the rapid growth bring? Was the Taoiseach's pride justified? Were people happier, less stressed and more content? Did their health improve? Or the physical and social environment in which they lived? Or did the distribution of income change markedly, leaving some badly behind?
This report will attempt to answer these and similar questions. It is divided into two parts. First we will look at how the changes affected people's health and the way they felt about themselves. Then, in part two, we will explore the effects that growth had on society. However, as we will see, the health and societal aspects of life are closely linked.
Part 1. How the Celtic Tiger affected the nation's health
A. The quality of life
Did the increase in incomes fulfill their advertised promise and make people happier, less stressed and more content? Or, to put this another way, did the increase enable their quality of life to improve? Unfortunately, the quality of life, like happiness and contentment, cannot be measured directly and it is very difficult to measure trends in the quality of life over time. Nevertheless, many recent surveys clearly show that during Ireland's high growth years a deterioration took place in many of the factors that make up the quality of life.
One of these factors was the level of stress under which people found themselves. Several reports show that this increased significantly. For example:
- A survey of 1,000 people carried out in 2001 on behalf of the Mental Health Association of Ireland4 found that 73% reported finding life more stressful than five years previously; 19% of the respondents said they were smoking more and 17% said they were drinking more in order to cope with their stress.
- A National Health and Lifestyle Survey of 6,539 people in 1999 to ascertain what people believed would best improve their health5 found that the majority reported 'less stress' regardless of their age, sex and social background. A follow-up report in 2001 also reported that stress was the most common answer for both males and females.
- An online survey6 in 2001, a sample of 2000 students was asked if they thought that the level of stress experienced by the general Irish population had increased. Over two-thirds said that it had increased a lot, 30% said it had a little and only 3% said not at all.
- The 2004 Amarach report found that between 2001 and 2004, the proportion of people who said they suffered from stress 'often', rose from 9% to 14% and half the population suffer from stress 'sometimes or often', up from 41% just three years previously. Furthermore, the proportion of people who thought that the pace of change in Irish society was too fast had almost trebled since the mid-1990s.
- A 2002 study7 of attitudes in the workplace found that 77% of respondents said that the economic boom had not improved their quality of life. Almost half of the sample of 344 people interviewed at work felt that they were caught up in a rat race; a third said they were continually tired and over a quarter complained of excessive stress levels. The main cause of their absences from work was found to be the stress they experienced while they were there. Almost a quarter of them said that they suffered 'great stress from bullying, back biting and other forms of aggressive behaviour and intimidation'. Over a half reported that they did not have a satisfactory balance between the demands of their work and the time that they devoted to their personal lives.
Longer working hours may partially explain this lack of balance. The hours Irish people worked increased substantially during the high growth period. As shown in Figure 3, Ireland came third highest out of 23 countries in terms of the increase in hours worked between 1995 and 2003. A survey in August 2002 on behalf of the National Economic and Social Forum8 found that 83.5% of respondents said that they would like to meet up with family and friends more often. The greatest single barrier to this was reported to be lack of time due to paid work. This makes it unsurprising that the 2004 Amarach report9 found that almost a half of all workers said that they would like to retire before the age of 55, compared with one third in 2001.
Working hours increase
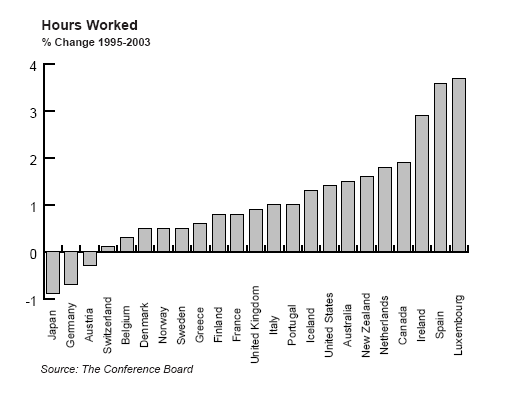 |
Figure 3: A small amount of the increased incomes people received was due to their working longer hours. Between 1995 and 2003, the average hours worked by Irish employees rose by almost 3%, one of the biggest increases in the OECD. This left less time for other activities and almost certainly led to increased stress. Working hours fell slightly in two countries with rising unemployment, Germany and Japan. |
More depressive disorders: In 200310 , research involving a representative sample of 12,702 women in four European countries found that women in Dublin were more susceptible to depressive disorders than those in similar cities in other countries. One in three suffered from depression. One of the authors, Professor Patricia Casey commented 'This [study] was conducted at a time of economic boom, when you would expect depressive disorders to reduce'11 .
The 2004 Amarach report found that although there was a positive relationship between feeling less miserable and increased GDP, the measure of life satisfaction has fallen steadily in recent years, returning to levels last seen in the mid 1980s.
Satisfaction with life drops by half
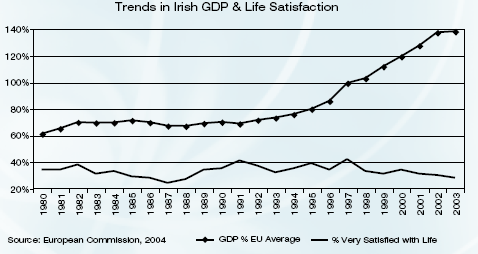 |
Figure 4 At the end of the high growth period during which Irish GDP climbed in relation to the EU average only half the number of people said that they were very satisfied with their lives as had done so before growth took off.
|
In view of these studies, it is not surprising that one of the EU's regular Eurobarometer surveys12 , showed that only 30% of Irish people reported themselves to be very satisfied with their lives in spring 2002 compared with 42% in 199713 . Nor that the Mid Western Health Board reported14 in January 2004 that 60% of the men randomly selected in a survey it had carried out agreed with the statement, 'that the lot of the average man is getting worse'. A third of the men surveyed believed that they had little control over their lives and 4% had actually planned their own suicide. In short, there seems little doubt that for many, rapid economic growth, longer hours and higher pay led to less satisfying, more stressful lives.
No increase in life satisfaction
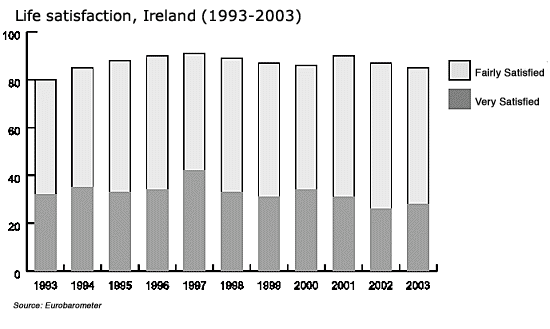 |
Figure 5: Each year, the EU's Eurobarometer team asks a random sample of the inhabitants of each member state whether or not they are satisfied with their lives. The results for Ireland show that the number of people expressing themselves as very satisfied has fallen from a peak in 1997, despite the massive rise in average incomes.
|
It has to be said, though, that not all surveys were negative. The 2002 Amarach report15 Quality of Life in Ireland found that the proportion of all respondents reporting feeling stressed 'often or sometimes' declined from 48% in 1999 to 41% in 2001. Moreover, 77% of people believed that the quality of life in Ireland had improved over the previous five years. On the other hand, one in ten adults thought it had worsened. Those thinking this way were predominantly 'in the older age groups and the lower social classes'. This group also reported that their personal quality of life had worsened.
B. How did the distribution of income in Ireland change?
As one might expect in a period in which the average income doubled, the number of people living in conditions of basic deprivation fell from 15% in 1994 to 5.5% in 2003. This was very good, since basic deprivation means not being able to afford to have some of the things that most of us would regard as essential, like heating on a very cold day, a waterproof coat, a change of shoes, and at least one substantial meal each day. In short, it means absolute poverty.
But there is another form of poverty, too, and that increased. It is relative poverty, This was defined in the 1997 National Anti-Poverty Strategy as living on income and resources (material, social and cultural) which are so inadequate as to preclude people "from having a standard of living which is regarded as the norm for other people in society''. It is generally accepted that living on less than half the median income (that is, less than half income that the middle person received if everybody in the country lined up according to their earnings) involves relative poverty. This more than doubled, from 6% in 1994 to 12.9% in 2001.16 The National Anti-Poverty Strategy concentrates on reducing absolute poverty and does not have targets to reduce relative poverty. To those who believe that relative poverty does not cause stress and despair, Padraig O'Morain17 says 'Tell that to the lone parent who is so in debt that she is afraid to answer the door, but whose child wants a €35 pair of Nike runners and will not wear a perfectly adequate €15 pair of non-Nike runners from a department store'.
Figure 6 shows that the incomes of those at the top of society increased strongly as a result of the growth, while those at the bottom were left behind. It divides the Irish population into ten groups of equal size on the basis of their incomes. The groups range from the poorest 10% of the population on the left to the richest 10% on the right. The chart shows that between 1994/95 and 2000, seven out of the ten groups (deciles) saw their share of the national income fall in relation to the other three groups. While the 5th decile saw its share increase slightly, the most significant feature was the gains made by the top 20% and particularly the top 10%, which stand in marked contrast to the experience of the rest of the population. The chart was prepared by Micheal Collins of Trinity College, Dublin, for the Conference of Religious in Ireland18 a body which has followed recent changes in the distribution of income with some care. Collins found that the gap between the top and bottom of the income distribution widened for three reasons. These were: the segmentation of the labour market into high and low skills; in that highly skilled people did very well, low-skilled people badly; tax cuts that gave most benefit to those with higher earnings, and the fact that social welfare payments grew more slowly than average incomes.
The rich get much richer
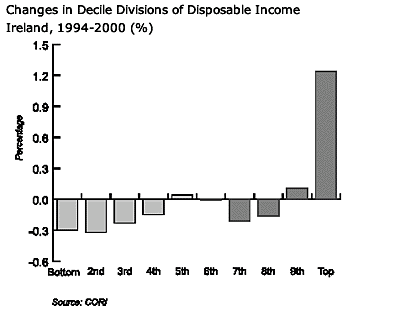 |
Figure 6 In the high growth years between 1994 and 2000, the share of national income going to the top 20% of the Irish population grew at the expense of almost everyone else. The top 10% did particularly well. |
Roughly three times as many adults were living in relative poverty in 2001 as had been the case seven years earlier. As Table 1 shows, the deterioration was worst among the elderly, whose incomes did not keep up with the rest of the population. The percentage of people over the age of 65 living in relative poverty increased over sixfold in the years 1994-2001. If the numbers of people on old age pensions are categorized as being under the 60% median income line, approximately one in twenty were below this limit in 1994; by 2001, it had risen to almost one in two19 .
As Table 2 shows, carers, the old and the ill were also amongst those left behind economically. There was almost a sixfold increase in the percentage of people in relative poverty who were ill or had a disability. There was a similar increase in the percentage of people categorized as 'performing home duties' and a threefold increase among people who had retired living in relative poverty. Table 2 also shows that almost five times the proportion of employees were in relative poverty in 2001 compared to 1994, reflecting the deterioration in the position of less-skilled workers. In short, not everyone gained from the economic growth.
More poverty in old age
| 1994 | 1997 | 1998 | 2000 | 2001 | |
| % | % | % | % | % | |
| Adults | 4.3 | 6.4 | 8.1 | 10.8 | 12.4 |
| Ages 16-64 | 4.6 | 7.1 | 8.6 | 10.6 | 11.3 |
| Aged 65 or more | 2.8 | 2.6 | 5.7 | 12 | 18.2 |
| Children (under 18) | 9.4 | 13.8 | 14.2 | 15.1 | 14.2 |
| Table 1 shows the percentages of the people in each age category who received an income of less than half the national median income. The figures clearly show that, during the high growth years, increasing numbers of people saw their incomes fall behind. | |||||
Carers, the sick and the old lose out
| 1994 | 1997 | 1998 | 2000 | 2001 | |
| % | % | % | % | % | |
| Employee | 0.6 | 1.2 | 0.4 | 2.3 | 2.9 |
| Self-employed | 9.9 | 10.7 | 12.6 | 12.7 | 10.6 |
| Farmer | 10.2 | 6.2 | 5.5 | 17.1 | 12 |
| Unemployed | 19.1 | 39.8 | 41 | 37.3 | 33.8 |
| Ill/have a disability | 10.1 | 27.5 | 43.6 | 45.3 | 59 |
| Retired | 4.0 | 2.1 | 6 | 12.1 | 15.3 |
| Home duties | 5.7 | 8.9 | 21.2 | 24.8 | 31.2 |
| All | 6.0 | 8.4 | 9.9 | 12 | 12.9 |
| Table 2 shows the proportion of people in each employment category who received incomes less than half the national median income. As the Celtic Tiger ran its course, carers, the retired, the unemployed and the sick and disabled got progressively worse off in comparison with the rest of society. Many employees' incomes fell behind too. Source: Monitoring Poverty Trends in Ireland 2003, ESRI | |||||
In an earlier study, the ESRI20 found that 1 in 10 of those who had lived below the relative poverty line for a year had sunk into absolute poverty while after five years below the line, the proportion had risen to a half.
Impact on children
Children were also badly affected by the income changes. As table 1 shows, the percentage of children living in relative poverty increased from 9.4% in 1994 to 14.2% in 2001. Other observers drew similar conclusions:
- In 2003, the Combat Poverty Agency described the level of child poverty in Ireland as 'relatively high', with 6.5% per cent of children at risk of consistent poverty and nearly a quarter of all those under 18 living in low income households21 . In its 2003 pre-budget submission, the St. Vincent de Paul society noted that '70,000 children did not necessarily have enough food, warmth or a second pair of shoes'22 implying that they lived in homes in absolute poverty.
- A UNICEF survey23 , published in 2000, of the extent of child poverty (which the researchers defined as being brought up in a household where less than 50% of the national median income was coming in), placed Ireland sixth worst out of 23 countries, as it had 16.8% of children living in such households whereas the average for the countries involved was 11.87%. Mexico and the United States had the worst records. The report warned that 'many of the most serious problems facing today's advanced industrialized nations have roots in the denial and deprivation faced by many in childhood.'
- A Combat Poverty Agency24 (CPA) survey of low income families in late 2000 found that only a quarter of children living in poverty were happy with their lives; they had concerns about 'fitting in' and had a fear of being different. A quarter of the deprived children were being bullied in school, causing some to leave early. One in three reported health problems. 'By allowing child poverty to continue in this country, we are denying over a quarter of a million children their basic rights to fulfill their talents and potential,' Hugh Frazer, the then director of CPA commented. 'How children live today powerfully influences how they will live tomorrow. Poverty has negative effects on the health and development of children. Those who grow up in poverty are likely to do less well educationally, have fewer recreational, social and cultural opportunities and are more at risk of being involved in crime and anti-social behaviour.'
The Chief Medical Officer, Dr. Jim Kiely, stated in his annual report The Health of Our Children 2002, that 300,000 children under 14, one in four, were being brought up in a home where the income was less than €175 a week, and that 17 per cent were experiencing chronic poverty. He admitted that this proportion was higher than in most European Union countries25 and added that the socio-economic conditions in which children lived were among the key determinants influencing their health.
Despite his recognition that poverty causes illness in children, he noted that the data on how it does so and the extent to which it does were very limited. 'We have some way to go before we have the information available which enables us to produce a comprehensive picture of the health of our children' the CMO wrote. 'There are considerable gaps such as information from out-patient and primary care, mental health information and chronic disease information.'
He was right. The data collected on child health in Ireland are not coded by socio-economic group26 , even though international research has indicated that adverse socio-economic circumstances in childhood are associated with stroke, heart disease, respiratory disease and stomach cancer in later life27 28 and that the level of infant mortality is directly proportional to the degree of income inequality29 .
Farmers suffer
Another group to be badly hit by the changes in the high-growth years were farmers and 35,000 of the 275,000 working the land in 1998 had left it by 2002. A major factor in their decision to leave farming was that between 1996 and 2002, agricultural output prices fell by 5% while input prices rose by over 9%30 . It is not surprising then that the Living in Ireland survey found that farmers made up a significant proportion of those living in relative poverty. 'There is no getting around the fact that there is a feeling of an occupation in decline,' commented Mike Magan of Agri-Aware31 . 'There is huge uncertainty and great worry, and that can make people feel very isolated'. As one farmer put it32 'If 20% of the people expand to survive, another 50% will be put out of business. What will happen to them?'
After farmers had donated €28,000 to the Samaritans in 2003 to help the organization combat loneliness and depression in rural areas, Paul O'Hare of the Samaritans commented that farmers were subject to uncertain seasonal factors and were looking at reduced incomes.33 As a result, they could find themselves under considerable stress particularly if they were trying to support a family.
C. Psychological stress of poverty
Not only has research clearly established that living in relative poverty damages both physical and psychological health, studies have also found that, not surprisingly, the damage is proportional to the degree of poverty. For example, the ESRI34 found that people who were consistently poor suffered more psychological distress than those who were categorized as potentially poor, who in turn appeared to suffer to a greater degree than those who were in neither category. ('Consistently poor' referred to people who were living below 60% of the mean income and experiencing basic deprivation in relation to a standard set of items while 'potentially poor' was defined as living below 60% of the national mean income and not having one of five stated luxury items). There was also, not surprisingly, a strong relationship between the degree of fatalism felt and the number of years the person had been poor. The authors write 'we found a clear relationship with the sense of control over one's life decreasing as the period of income poverty increased.'
Several studies have shown that continual stress (which includes psychological distress) weakens disease resistance. For example, stress has been found to influence cardiovascular and immune disorders35 , ulcers36 , and strokes37 , but not cancer38 . A longitudinal study 39 published in the Proceedings of the National Academy of Sciences established a link between long-term stress and the release of chemicals involved in both immune system regulation and the development of cardiovascular disease and myocardial infarction, adult-onset diabetes, osteoporosis, arthritis and congestive heart failure. Researchers have found that greater job stress is associated with higher cholesterol, a person's body mass index 5 to 10 years later and cardiovascular mortality regardless of factors such as age, exercise habits and smoking. In a 28 year study40 of workers in Finland, Kivimäki and colleagues found that work stress doubled the risk of cardiovascular death.
People who suffer from clinical depression have been found to have a three- to fourfold increase in the risk of a heart attack41 . A correlation was also found42 between long-term work stress and high blood pressure. 'Work woes could contribute to problems with blood clotting or insulin resistance, a precursor to diabetes, which in turn is a major risk factor for heart disease and stroke,' the study added. Other researchers have shown43 that the heart conditions of men who show stress-induced blood pressure reactivity and who report high job demands deteriorate more rapidly than those in less stressful situations. This finding was independent of other known risk factors and suggests that the traditional medical advice about cardiovascular health - stop smoking, cut down drinking, eat less fat, and engage in physical activity - needs to be supplemented by reducing stress at work.
D. The effects of stress on health
We saw earlier that people complained about increased stress during the period of very rapid economic growth between 1994 and 2002 and that relative poverty also increased during that time - a change which would have created great stress in the groups that lost out. We've also seen evidence that stress weakens the body's immune system and leads to increased illness. Accordingly, although it might take some years for the full effects of the stress to show up in the statistics, I thought it worthwhile to check whether health in Ireland did in fact deteriorate during that period, or at least improve less than in other similar but less-stressed countries.
| Males | Females | |
| Ireland | 75.1 | 80.3 |
| EU 15 | 75.8 | 81.6 |
| Table 3: Life expectancy at birth 2002 Source CSO | ||
| Males | Females | |
| Ireland | 15.4 | 18.7 |
| EU 15 | 16.3 | 19.9 |
| Table 4: Life expectancy at age 65 Source CSO | ||
World Health Organization figures show that Ireland, at 46 per 100,000, has by far the highest death rate for heart disease for those under 65 in the countries in the European Union, the EU average being just 2547 . In fact, the Department of Health's own website shows that for all major disease groups apart from stroke and motor vehicle accidents, Irish mortality rates are higher than the EU-15 average. This can be seen in Table 5.
Irish death rates compare badly with other EU states
per 100,000 population
| Ireland | EU-15 average | |
| All causes | 734.3 | 687 |
| Ischaemic heart disease | 160.2 | 107.6 |
| Lung cancer | 39.4 | 38.5 |
| Breast cancer | 35.2 | 28.2 |
| Suicide | 11.5 | 10.7 |
| All circulatory diseases | 286.8 | 266.82 |
| All cancers | 197.2 | 187.6 |
| Meningitis | 0.4 | 0.2 males 0.1 females |
| Stroke | 60.9 | 67.2 |
| Road traffic accidents | 9.0 | 10.7 |
| Table 5: Irish mortality rates are worse than the EU average for almost all diseases except strokes. No allowance has been made in this comparison for the age distribution of the different countries' populations. If this were done, Ireland, with a relatively young population, would fare even worse. The Irish data is for 2001 while the EU data is for 1998 Source: Department of Health website 2003 | ||
E. Health and Relative Income
Before looking at more data to see what actually happened to health in Ireland during the high-growth years, let's look more closely at what researchers have found out about the relationship between health and relative income.
One's health depends on the interplay of many factors. Robin Stott in the Schumacher briefing, The Ecology of Health 48 suggests that 80% of our health is determined by factors outside the scope of the conventional healthcare sector. Socio-economic influences on health have been comprehensively explored by Richard Wilkinson of the Trafford Centre for Medical Research at the University of Sussex49 since the mid-seventies. 'The distribution of income is the single most important determinant of levels of health in the developed world' he writes. 'It has now been demonstrated [many] times using different measures of income distribution from different countries at different dates .. About two-thirds of the variation in life expectancy between these countries is related to differences in their income distribution.' This can be seen in figure 8.
Higher national incomes don't always mean better health
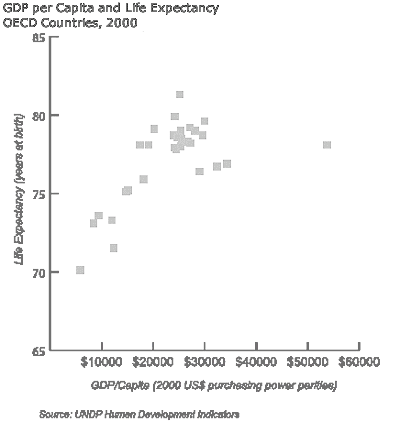 |
Figure 7: This graph uses more up-to-date data than that used by Wilkinson. It shows that life expectancy at birth does tend to be longer in countries with higher average incomes per head but that countries with an enormous range of average incomes per head (ranging from less than $20,000 to almost $60,000 in the graph) can have the same life expectancy and that countries with the same or greater average incomes can differ in life expectancy by five or six years. Those countries with the longer life expectancies tend to have smaller income differences between rich and poor as shown in Fig. 8 |
Wilkinson found that there was no link at all between GDP per capita and life expectancy in twenty-one OECD countries and that the proportion of national income going to the poorest 70 per cent of families explained most of the international variations. Even the proportion of national income devoted to health care had a negligible explanatory effect. He writes:
Since the early 1970s, Japan has gone from the middle of the field in terms of life expectancy and income distribution to the top in both. Japan now has the highest recorded life expectancy and the most egalitarian income distribution in the world. On the other side of the coin, while Britain's income distribution worsened dramatically during the eighties to produce the largest inequalities for over a century, its relative position in terms of life expectancy has also worsened. Each year since 1985 mortality rates among both men and women between the ages of 16 and 45 have actually risen - a trend which is not attributable to deaths from AIDS50 .
Greater income equality means longer lives.
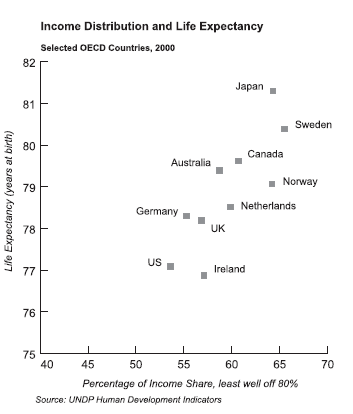 |
Figure 8 shows that the more equally national income is distributed, the longer people tend to live. Sweden, which reduces relative poverty by taking a very high proportion of its citizen's incomes in tax and redistributing a lot of that to the less well-off, enables its citizens to live longer than equally rich countries with a bigger gap between rich and poor. |
Wilkinson is certain that differences in absolute poverty do not account for the differences in death rates among rich countries. He maintains, for example, that the improvement in the health of people in Japan could not be explained by dietary changes, smoking and other behavioural factors affecting health, in health services and other preventive health policies.
We are not dealing with the effects of residual poverty in the developed world - there are too few people in absolute poverty in each of the developed countries for their death rates to be the decisive influence [on the overall statistics]. Some people in rich countries were unable to eat properly even though they had incomes which were theoretically adequate to cover the cost of essentials because they were forced to buy 'inessentials' like rounds of drinks if they were to participate in ordinary activities in their communities. Others had to live in damp housing. However, neither of these circumstances could account for most of the increase in the gap between death rates. These differences were found after controlling for the effects of average personal disposable income, absolute levels of poverty, smoking, racial difference, and various measures of public or private provision of medical services.
He further states that health inequalities within countries cannot be understood in terms of selective social mobility, genetic differences, and inequalities in health care or health-related behaviour. 'Relative poverty is a demeaning and devaluing experience and a sense of relative deprivation will reduce people's sense of self-worth and self esteem,' which then affected their health. 'What people feel about their housing, their financial and social circumstances and what that does to their morale is likely to be more important [to their health] than their objective conditions.' Relative poverty leads people:
To feel depressed, cheated, bitter, desperate, vulnerable, frightened, angry, worried about debts or job and housing insecurity; to feel devalued, useless, helpless, uncared for, hopeless, isolated, anxious and a failure: these feelings can dominate people's whole experience of life, colouring their experience of everything else. It is the chronic stress arising from feelings like these, which does the damage. The material environment is merely the indelible mark and constant reminder of the oppressive fact of one's failure, of the atrophy of any sense of having a place in a community, and of one's social exclusion and devaluation as a human being.
This leads him to suggest that health statistics could be used as an indicator of the subjective aspects of the quality of life.
Wilkinson is by no means alone in stressing the importance of relative income to health. Ichiro Kawachi writes51 in his book The Health of Nations: Why Inequality is harmful to your health 'The degree of income inequality in society explains about three quarters of the variation in life expectancy across countries, whereas by itself, the absolute size of the economic pie (measured by per capita GNP) accounts for less than 10%.' He adds that income inequality and poverty rates could together explain about one quarter of the differences between countries in overall mortality rates, as well as just over half of the variation in murder rates.
This article may not be exactly as it appears in the printed Feasta Review as minor changes may have been made to it at the page proof stage. The pdf version is the printed text.
| This paper is from Growth:The Celtic Cancer, the second Feasta Review. Copies of the Review can be ordered online from Green Books, priced at £9.95 plus postage and packaging. |
 |

