This paper describes a simulation study undertaken with the aim of exploring the potential for renewable energy to make a key difference to the future sustainability of the Republic of Ireland. We begin by looking at the electricity-generating sector itself, and move out from there to consider some complementary technologies that will interact well with renewables-generated electricity in moving Ireland towards a more sustainable state.
The modelling approach we used was ECCO, originally developed by Jane King & Malcolm Slesser (Slesser & King 1993; Slesser et al, 1994, 1997). It provides a broad-brush sketch of the entire economy which allowed us not only to calculate the direct impacts of renewables on the electricity-generating sector, but also the synergies that may exist between renewable generation of electricity and other technologies and economic activities. We were not primarily concerned with forecasting, but with representing the potential for change of the economy under a range of scenarios.
ECCO has a number of characteristic features, physical, dynamic and holistic:
A) Physical
ECCO is primarily a physical account of the economy. Energy analysis theory, as defined in the proceedings of the IFIAS workshop of 1975 (IFIAS, 1975) underpins the model, and is explained in the primer which follows this article. It explicitly recognises the importance of the second law of thermodynamics in limiting the options available to the economy. According to this law, any transformation to a system incurs a net dissipation of energy and an overall increase in the entropy (which can be thought of as a measure of disorder) of the system.
Within a system, the entropy of a local region can decrease if it is able to export the entropy increase elsewhere. In industrialised economies, we generally order our built environment by exporting huge volumes of disorder to natural ecosystems, as dissipation of energy resources and as pollution. This behaviour was first formally described in these terms by Ilya Prigogine and colleagues as 'open systems' (Prigogine & Stengers, 1984). National economies such as the Republic of Ireland are very much open systems, interacting not only with natural environments, but with the global political environment through trading goods, services and financial flows. (Financial flows have no direct physical presence themselves but determine the direction in which physical effort is expended).
By describing the economy in such physical terms we get a direct handle on some of the key interactions with nature, such as rates of fossil fuel extraction, use of materials and emission of atmospheric pollutants, as well as many interactions that occur within the economy. However, our concern with exact thermody- namics does not overshadow our desire to accurately describe aspects of the real world, and we do not try to superimpose a grand theory of energetics upon reality. Where appropriate, other units are used to measure specific variables (e.g. transport demand in passenger-km and tonne-km for freight).
B) Dynamic
ECCO is a dynamic model. It does not describe the state of the economy at a single point in time, but the unfolding of events in the economy over a period of decades. It is suited for describing long-term economic patterns over such timescales, but less suited for explaining short-term fluctuations over periods of months or quarters. The computational techniques used to describe these dynamic relationships are classical system dynamics, as developed by Jay Forrester & colleagues in the 1960s at MIT (Forrester 1968, 1971; Meadows et al, 1973).
The dynamic nature of the model is important in deeper ways than simply allowing us to describe key indicators as time series rather than snapshot values. A simple linear programming model can accomplish this. System dynamics, however, excels at describing complicated feedback interactions between many factors, and the ECCO model contains many feedback loops. These often lead to counterintuitive behaviour in the model, that is, behaviour that may seem to be unexpected at first glance, but, when its causes are traced back through the model structure, does make sense. When we engage with the model in this way, we are encountering questions about the way our economy operates, and gaining insights that are qualitative as much as they are quantitative.
As an example, a model may show that making a large reduction in energy demand for a sectoral activity at negligible capital cost causes the economy's overall energy demand to decrease initially, but increase in the longer term. This latter increase is counterintuitive, but can be explained by the mechanism that decreased energy demand either benefits balance of payments or reduces required domestic energy extraction investments, allowing the economy to grow at a faster rate than it otherwise would. This 'rebound effect' is discussed in greater detail in Slesser et al, 1997. The point is that formalising the structure of the economy in our model has brought to our attention an inherent outcome of the assumptions that we have fed into it that had previously not been noticed. Even if we recognise that the model is a very limited representation of reality, with many factors simplified or omitted (and this is true of any model, however detailed), we can take the insight about rebound effects away with us and consider its place in the real world. This qualitative insight is arguably more important than the numerical time series data that the model generates.
The world-view of the dynamics modeller informs our definition of sustainability too. We do not seek to describe sustainability as an endpoint, a goal that our model economy seeks and then steps into some sort of steady state once it reaches it. If we were to consider that an economy achieved sustainability by 2050, and was still sustainable in 2100, it is unlikely that the two economies would be identical. They might be radically different in some ways.
C) Holistic
ECCO is a holistic model. Rather than covering one part of the economy in fine detail, the entire economy is described in coarse detail. Specific sectors may be developed to a greater level of detail than others (in our case, electricity generation and energy conservation, for example), but all sectors are represented at some level of detail. Because the model determines its own growth rate (see below) it is important that we know the demands and supplies associated with all parts of the economy in order to assess the overall growth potential. A sector described at the lowest level of detail can be thought of as a placeholder. It is unlikely to do anything surprising during a simulation. When developing a model for specific purposes, we need to evaluate where we wish to apply detailed policy options, and from there, what level of detail is appropriate for the other major sectors. For example, if we were to develop a model with the aim of studying water usage, we would need a high level of detail in the industrial, domestic, agricultural and possibly electricity generation sectors. Services and transport sectors could be simpler, taking their cues from the ups and downs of the more detailed sectors.
In some studies, the broad overview offered by ECCO has been usefully combined with more detailed static analysis (Crane & Foran, 2000). Where this has been done, much of the crosstalk between the models has been conducted through a sharing of insights, rather than an attempt to hitch the computational data streams together into a single super-model.
SELF-DETERMINING GROWTH RATE
The model will determine its own growth rate over time. Most dynamic economic models will feed in the average growth rate as a user-defined input. We allow the modelled economy to grow as fast as is possible under the policy options that are in place. User-defined policies may well affect growth rates, albeit indirectly, and these allow us to capture some of the more subtle long-term effects of policy options (such as the rebound effect described earlier).
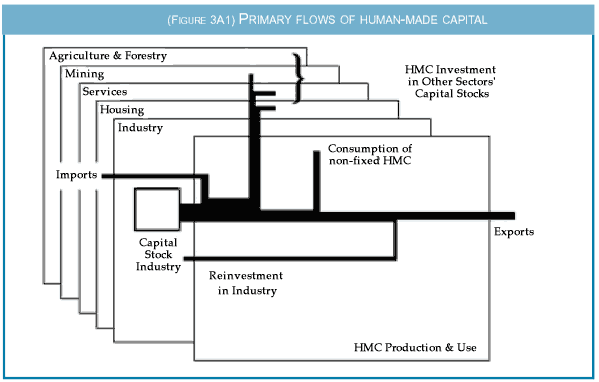
The model's central 'growth loop' represents the key influences described by the model that lead to physical growth in an industrialised economy. All variables here are referred to in embodied energy terms. An 'industry' sector is defined as containing all those activities that produce physical goods. Other sectors are also defined, such as agriculture, services, housing, etc. These all contribute meaningfully to the economy, and all require a stock of fixed capital (buildings, machinery, etc.) through which to do so. Only the industrial sector is able to supply that capital - either the domestic industrial sector, or one overseas, at any rate. International trade complicates the picture a little, but can be adequately handled by the 'growth loop' model.
As shown in Figure 3A1, the aggregated flow of 'human-made capital' (HMC) from the industrial sector can be diverted to a number of purposes:
- consumption of non-fixed/disposable products
- reinvestment in and maintenance of the capital stocks of industry
- reinvestment in and maintenance of the capital stocks of other sectors
- exports of goods to other economies.
 |
Note that all capital stocks depreciate (an inevitable consequence of the second law of thermodynamics, and a practical fact), and maintaining a sector at a given size requires continual investment. The overall demands for reinvestment by all other sectors will be determined by the assumptions we make about them, and by policy options that we may set. For example:
- required investment in energy will be driven by market forces in most western economies. Ultimately, this will depend upon a diverse range of factors, such as energy costs of extracting the fuels, comparative energy costs of alternative fuels, and demands for the fuel by the domestic economy and export market. All of these factors can be represented in the model.
- required investment in housing will be driven by population in a very simple model, and possibly by a measure of affluence. In a more complex model, we may also wish to introduce average size of a household in capita terms. Many western economies have seen considerable decreases in average household size over the last few decades, with considerable consequences on per-capita consumption of energy and resources of a domestic nature (a six-person household does not generally own a house six times the size of a one-person household, nor a fridge or heating system consuming six times the energy). If we choose to consider the social dynamics of increasing divorce rates and decreasing family sizes, we can see implications for our physical growth loop.
We calibrate the rate of consumption of disposable goods based on short-term indicators of economic well-being, and, after factoring in balance of payment adjustments, allocate the remainder to industrial reinvestment. If this amount exceeds the rate of depreciation in industry, our industrial sector will grow over time, and hence the future production of human-made capital will increase, all other things being equal (and we can break that assumption and model effects of technological change within industry if we wish to). Conversely, if the reinvestment in industry is too small, future output of HMC will contract, to the detriment of the entire economy. Because this reinvestment term is sensitive to changes in consumption, in investment in every sector and to international trade in goods, services and financial flows, the growth of the model as a whole is sensitive to a wide range of policy options.
Figure 3A2 portrays the growth loop in terms of
influences between terms, with the arrows
pointed from influencer to influenced.
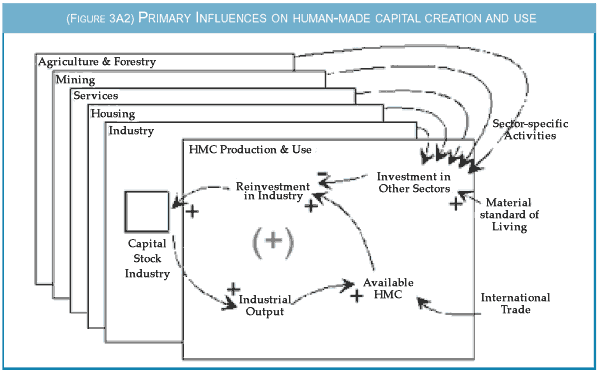 |
A plus sign indicates that the variables will move in the same direction (as x goes up, it will push y up, as x goes down, it will push y down), and a minus sign opposite directions.
Finally, it is worth elaborating a little on the balance of payments sector. In a national economy, there will be significant trades with the outside world, in physical goods, in services, and in financial flows. The physical flows can easily be incorporated into the above model, and in some cases (notably energy resources) will already be calculated by the model. In the case of intangible trades, we convert these to a nominal embodied energy value based upon the average energy intensity of the economy, a term that we calculate for internal accounting purposes anyway. An economy that exports significant intangibles (e.g. Switzerland) can, as a result, afford a much greater inflow of HMC than would otherwise be possible. The internal costs of generating such flows can be accounted for in our representation of the services sector, which would probably be quite detailed for such an economy.
THE IRISH MODEL
The pilot model of the Republic of Ireland was developed over a period of approximately six months. We aimed to replicate the broad growth patterns of the Irish economy over the period 1990-2002 (or as recently as official time-series have allowed), and then simulate them out to 2050. This was successfully achieved, although inevitably some areas were sketched-in in relatively little detail. In describing the model, it is useful to note omissions as well as the detail that has been included, particularly for the sake of pointing to relationships between policies that we may have failed to capture in this first iteration of the model.
The model divides the economy into a number of broad sectors, following the sectoral divisions provided by the main data sources that we used to calibrate it. These are:
- Agriculture, Forestry & Fishing
This sector was sketched-in in terms of fixed capital stocks, and energy resource use. Future growth is driven by domestic requirements and export markets. No attempt was made to distinguish between types of agriculture, nor to assess land use. This latter would be required were we to factor in the land-use requirements of a large-scale biomass initiative (and, to a lesser extent, land-based wind generators, although it can be argued that these can happily coexist with many types of crops). - Mining, including gas and peat extraction
Our primary focus here was on describing the reserves of natural gas and peat, and the fixed capital stocks employed to extract them. Investment in these sectors was driven by domestic demand and world export markets (significant only in the case of gas). - Industry & Manufacturing
This sector was treated as a single entity, although in reality it covers a range of activities from heavy industry to food processing and the construction industry. (Even in much larger, more mature ECCO models we rarely disaggregate this sector.) The effects of investment in fuel-efficient technologies in this sector were characterised. - Utilities, primarily electricity generation
Electricity generation was divided into a number
of technologies, covering conventional fossil-
fired plant, combined-cycle plant (a more
modern technology with greater efficiency of
use of fuel), conventional hydro-electricity, and
renewables. Separate subsectors were drawn up
to characterise wind generation, photovoltaics,
biomass-generated ethanol and methanol plant,
and wave energy, although our analyses here
focussed primarily on wind power. Userdefined
policies for future uptake between
existing technologies were developed, with
Business-As-Usual policy allocating 90% of
new plant built beyond 2000 to combined-cycle
fossil plant, and 10% to renewables. The differences
between technologies were characterised
primarily as:
- Load Factor i.e. percentage of time a plant would typically be online
- Thermal efficiency of converting fuel to electricity (where the plant is fuel-powered)
- Fixed capital cost of building and maintaining
plant
We did not account for one potential benefit of wind power, that the technology could be developed indigenously, and potentially sold worldwide, whereas fossil-fired futures would be dependent upon foreign technology bases (and therefore represent a poorer situation for international balance of payments). - Services
The services sector was characterised in terms of fixed capital and physical resource consumption (e.g. thermal fuels, electricity). Demand for services was limited to the three major consumer sectors, industry, domestic dwellings, and the services sector itself. - Domestic dwellings
These again were characterised in terms of fixed capital and resource requirements. Effects of domestic energy efficiency technologies were taken into account (and here the payback could be significantly greater than in the industrial sector, owing to the poor starting position of the Irish housing stock in terms of simple energy efficiency 'quick wins' such as insulation), as well as potential for electricity-powered ground source heat pump technologies. - Transport
The transport sector does not maintain its own capital stock, as national accounts data describes the fixed capital in transport machinery as belonging to the owning sector e.g. industry, services, domestic. Energy use by transport is defined separately, though, and we were able to calculate demand based on passenger and freight volumes. Policies describing potential future modal splits between transport sectors are in place, as well as future fuel mixes, including electrically-powered passenger vehicles utilising fuel cell technologies. - International Finance
This sector defines the net impact upon the growth of the economy of international trade. Some parts of this can be characterised well by the model, such as the necessity of fuel imports, others are defined as user policies, such as future levels of international investment capital. Over the calibration period, Ireland enjoyed an unusually high influx of international capital, which we have allowed to decrease somewhat in the Business-As-Usual profile for the model.
DEFINITION OF SUSTAINABILITY
Sustainability is an ill-defined and much-abused term. For the purposes of assessing the relative merits of the outcomes generated by our scenarios, it is useful to have one or more sustainability indicators to hand. For this study, we focus primarily on energy-based measures, because we are looking at energy-related scenarios.
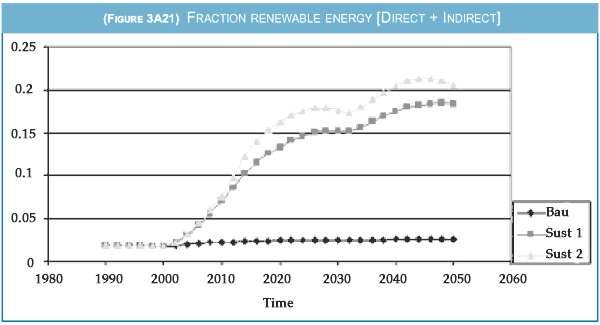
Carbon-dioxide emissions are a good sustainability indicator, and can be readily compared against the agreed Kyoto targets for the Irish Republic. If we define energy sustainability as receiving all energy requirements from renewable resources, we can compare our progress towards that goal by plotting fractions of energy derived from renewables, both for electrical energy and all primary energy. We also created a third variant for this study, in which we included indirect imports of primary energy in an attempt to reflect the energy expended elsewhere in the world. This would counter the 'accounting loophole' of the simpler indicator whereby an economy could simply shift energy- intensive activities overseas. In the case of the Irish model, it made only a slight difference in most cases.
In terms of security of energy supply, we could compare Irish demand for exported oil and gas against projected world outputs of oil and gas (using data from Campbell, 2002). Again, it is worth stressing that our assessment of the sustainability of each outcome does not end with the set of indicators outlined above, and that it is necessary to step back from the model and consider the results in the light of the real world.
CALIBRATING THE MODEL
The model was initialised for the year 1990, and run over a ten-year period against real historical data in order to calibrate it. The primary data sources used to calibrate the model were:
- National accounts data from the Central Statistics Office of Ireland (www.eirestat.cso.ie), particularly for the purpose of getting Gross Domestic Fixed Capital Formation (GDFCF) data (series naaa04xx) upon which to base the model rates of capital formation. In this case, as no Fixed Capital Stock data was available from the CSO, the GDFCF data was also used to estimate initial capital stocks by using a simple spreadsheet model that tracked growth and depreciation of sectoral capital stocks over the calibration period. The CSO bpaa series data was also used to calibrate the international finance sector of the model.
- Energy balance data for Ireland, from the Department of Public Enterprise. The report "Energy in Ireland" provides data for the period 1980-1993. Energy balances for 1994-2000 were taken from the DPI website (www.irl.gov.ie/tec/energy/statistics ). These provide a detailed breakdown of energy resource production, imports and domestic usage by sector, as well as transformations into secondary fuels such as briquettes and electricity. Combining the energy balances over the calibration period, it was possible to develop detailed time-series data of sectoral energy usage by fuel type.
- The Electricity Supply Board Annual statements contained much detailed information on generating capacities and types of generator, from which a more detailed description of the electricity generation sector could be developed.
- The final report of the EU-funded ALTENER report "Total Renewable Energy Resource in Ireland" provided helpful information when developing the renewable energy sector.
This calibration process led to the definition of
a business-as-usual (hereafter BAU) scenario,
in which current technologies and policies were
extrapolated out over a further fifty-year period.
This is not intended to provide for an accurate
forecast of Ireland's future, but to develop a
well-defined baseline against which we can
compare the effects of the changes we introduce
in our policy studies. In the electricity-generating
sector, we assumed that the majority
of new generating capacity would be gas-fired,
with a small fraction (10%) being wind energy.
We assumed a continued high level of investment
in Ireland from overseas, although less
than was seen in the 1990s, recognising this to
be an unusual decade. Key assumptions of the
business-as-usual scenario defined for the purposes
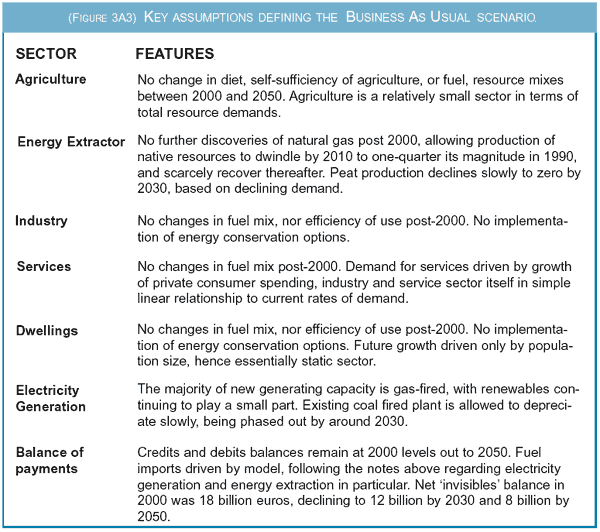
of this report are outlined in Figure 3A3.
Key features of the outcome of the Business- Scenario Policy Inputs / Scenario Definition As-Usual scenario are outlined below:
- The economy continues to grow, but very
slowly (figure 3A4).
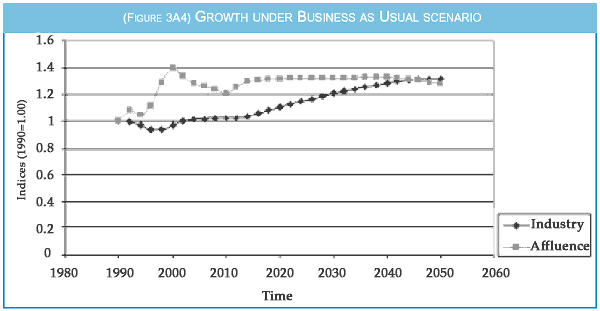
Growth Indicators under BAU scenario. Growth in both personal material affluence and manufacturing capacity is slow Our key indices of growth, for average per capita material affluence and manufacturing output, show less than a 50% increase over the 50 year period, equating to an average growth rate of less than 1%. This slow growth is in spite of the continued inward investment from overseas, and partly reflects the longer-term effect of this, as returns on the investment begin to leave the country.
- Carbon dioxide emissions show a decrease
from through to 2030 (figure 3A5), owing to a
combination of structural changes and economic
decline.
Beyond 2030 they remain essentially flat, in step with the negligible economic growth rates during the latter phases of simulation. The decrease from 2000-2030 can be explained by the phasing out of the current cohort of conventional fossil-fired electricity plant, and its replacement by more efficient combined cycle plant (figure 3A6).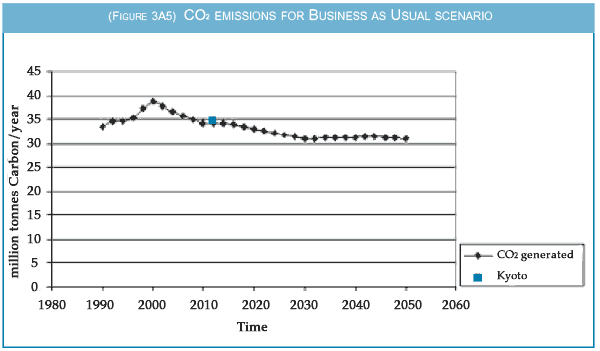
Projected CO2 emissions under Business as Usual. The temporary decline in emission rates (which does not mean a decrease in atmospheric CO2 levels) can be explained by looking at the changing structure of the electricity generating sector. Note that the model underestimates CO2 emissions for 2000 by roughly 5%, as the actual figure was around 41 million tonnes carbon/year.
This in itself is enough to meet the Kyoto requirements for 2012, with no positive action required. In terms of energy policy, it is apparent that there is a window of opportunity over the next thirty years within which alternative energy strategies can be developed while enjoying the benefits of the decline of this technology. Beyond 2030, achieving an active reduction in CO2 emissions would not be so easy, particularly if other policies were brought into play during the next fifty years that resulted in positive economic growth. The lukewarm 'good news' of matching the Kyoto targets shown here would be better characterised as a combination of opportunism and economic doldrums, and shouldn't be mistaken for actively getting to grips with the required decoupling between economic activity and fossil fuel use. (It is also worth pointing out that a flat CO2 profile is not particularly good news for the environment, as it simply represents a steadily increasing stock of CO2 in the atmosphere rather than a rapidly increasing one.)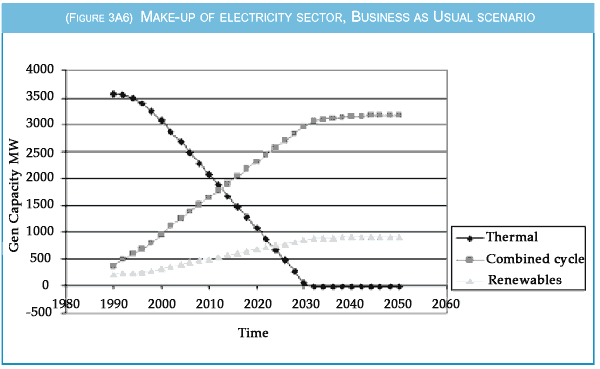
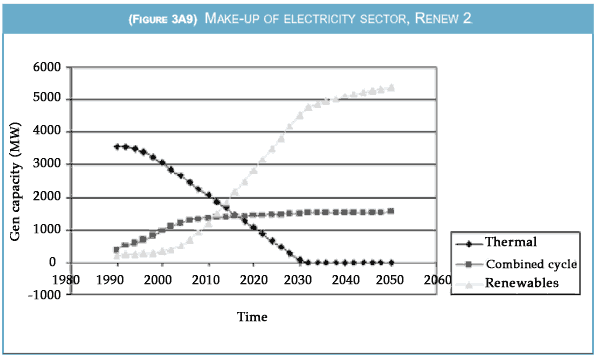
Make-up of electricity sector generating capacity under Business as Usual. Existing thermal capacity declines through to 2030, and the majority of new capacity is introduced as combined-cycle plant. Renewables play a minor but not inconsiderable role. - Dependency on imported fuels remains very high. Native supplies of natural gas are already mostly exhausted apart from the recently discovered Corrib field off the coast of County Mayo. We decided to treat this field as a nonnative resource as its owner, Shell, will find the capital for its exploitation outside Ireland and send almost all the money it receives for the gas outside Ireland too. As this makes gas from Corrib functionally identical to gas coming into Ireland across the interconnector, it allows it to be left out of the model. Ireland's only other indigenous fuel, peat is a small fraction of the total energy demand. Major fuel demands include natural gas for electricity (21% of total fuel demand by 2050), oil fuels for the transport sector (42% of total fuel demand by 2050) and domestic heating fuel (18% of total fuel demand by 2050). In terms of fuel supply security, the combination of declining native gas supplies and buying into a gas-dependent electricity future do not make for a good combination.
SIMULATION EXPERIMENTS
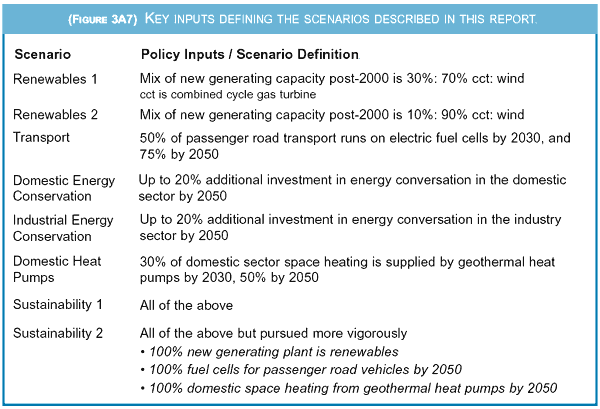
A number of simulation experiments were conducted
to assess the viability of some proposed
solutions to Ireland's (and the Western world in
general's) current sustainability problems of
reliance of depletable resources and increasing
carbon dioxide output. The options assessed
here are primarily technological. Figure 3A7
contains a brief summary of the changes to the
BAU profile made in defining all the scenarios
undertaken in this report.
 |
 |
RENEWABLE ELECTRICITY
Ireland has significant potential for renewable
electricity generation, primarily in the form of
wind and wave. Bio-fuels are also an option,
although not one that we examined in detail
here, as doing so would require a more detailed
model of land-use interactions between fuel
crops and other forms of agriculture than we
have currently developed. Compared to gasfired
combined cycle plant, wind power is
roughly 3 times more expensive to build (the
capital costs per megawatt of generating capacity
are not widely divergent, but the load factor
for CCGT is much higher, leading to a far
greater return in terms of electricity generated).
Potentially, a large-scale adoption of wind
power would have a negative impact on economic
growth as a result of this extra capital
expenditure (in the BAU scenario, investment
in the electricity sector accounted for roughly
5% of total investment in fixed capital stocks).
Although the economy can support the more
extreme penetration of wind power, overall, this
has a relatively minor impact on the sustainability
of the nation. As we pointed out earlier,
there are major direct demands for fossil fuels
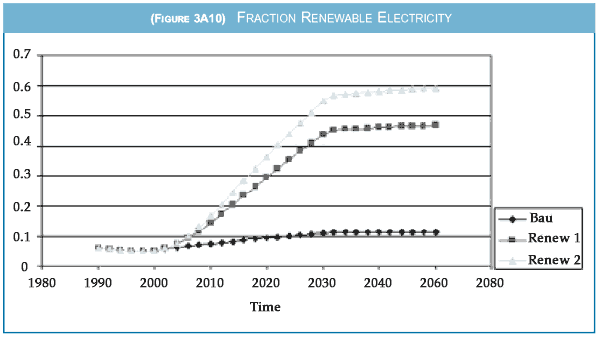
outside of the electricity sector. Figure 3A10
plots the rather smaller share that renewable
electricity gains of the economy's total energy
usage.
 |
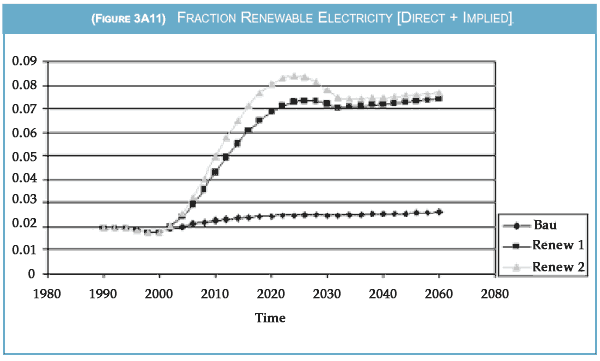 |
The 9-10% share achieved by the second renewables scenario is certainly an improvement on current arrangements, but is unlikely to make a long-term difference environmentally (the CO2 profile for this scenario is only 5% lower than for the BAU scenario by 2050). If renewables-generated electricity is to have a serious impact, it must also begin to replace some of these other demands. The remaining scenarios look at some options for doing this.
RENEWABLES-POWERED TRANSPORT
Fuel cells represent one technology that may be used in the transportation sector as an alternative to continued fossil fuel dependency. We made a broad assumption that an electricitypowered car could convert energy to motive power with roughly twice the efficiency of a petrol engine. The conversion of fuel to electricity (the thermal efficiency) for conventional electricity generators is roughly 30-35%, with combined cycle plant achieving a somewhat higher value. Hence, from a system-wide perspective, the use of fossil-fired electricity to power transport makes little sense.
In the case of renewable electricity, of course,
there is no initial fossil fuel input, and a clear
case for sustainable transport through use of
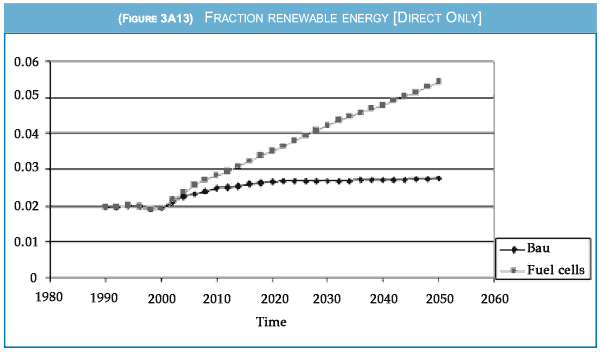
fuel cells can be made. We adopted the more
extreme renewable energy policy at the same
time as driving a significant substitution of conventional
road transport with electrical vehicles,
achieving 50% penetration by 2030 and a
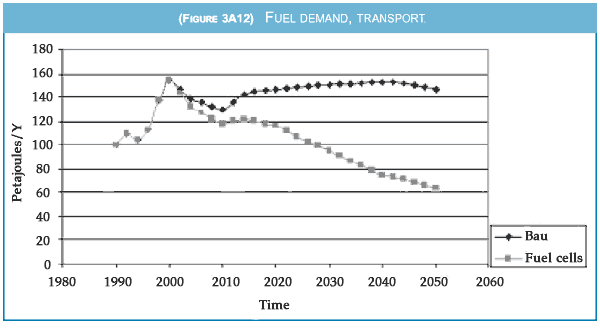
75% penetration by 2040. This has a significant
effect on the demand for thermal fuels by transport,
as shown in Figure 3A12, and reduces the
total energy demand of the economy by around
7% by 2050 when applied by itself, and has a
marginally positive effect on the fraction of
renewable energy use indicator (Figure 3A13).
 |
 |
Domestic energy conservation
Ireland's housing stock generates a significant thermal energy demand, used almost entirely for space heating. The current housing stock can be characterised as poorly insulated, with even modern dwellings tending to opt only for simple cavity insulation. A number of quick wins could be made by insulating this housing stock. We characterise the impact of investment in domestic energy efficiency as one of diminishing returns, assuming that the first investments made are the most cost-effective. The data we use is based on a study by the TNO, Netherlands (Melman et al., 1990), and probably under-represents the capacity of the Irish housing stock to benefit from such investments. Nonetheless, with sufficient investment, energy savings of up to 50% would be feasible, although this would require significant additional investment.
Under the domestic energy scenario, we invest
additional resources in the housing stock with
the express purpose of applying energy conservation
technologies, matching the main investment
in the domestic sector by 5% in 2010
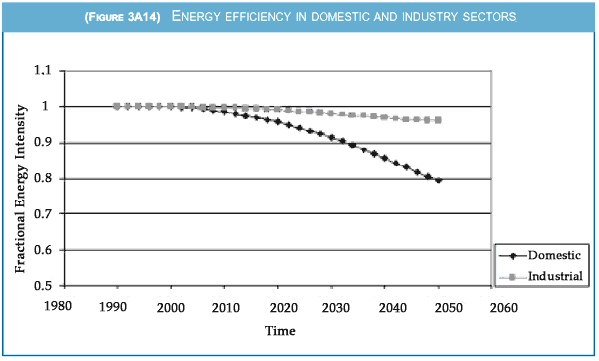
through to 20% by 2030 onwards. The knock-on
effect of this is to reduce energy consumption
per household by 20% by 2050, as these
investments trickle through the existing and
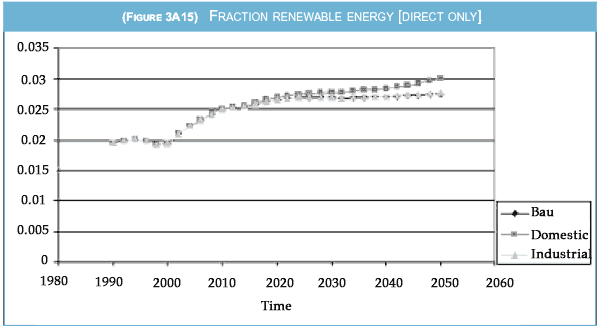
new housing stocks (Figure 3A14). Overall
effects on the fossil fuel dependency of the
economy are very marginal (Figure 3A15).
 |
 |
Industrial energy conservation
Industry and manufacturing is also a large consumer of fossil fuels. Here, the fuels are used to provide a mixture of heating and motive power, as well as cogeneration of electricity. Following the TNO study data, we assume that the returns on energy efficiency investment in manufacturing would be less than with the housing sector, with a maximum reduction of around 10% being achievable. These figures are, again, probably rather cautious, but we present them here in the absence of any other hard data.
The scenario here was defined in an identical fashion to the domestic energy efficiency case, with a ramping up of additional investment to match 20% of the primary investment in the sector by 2030. Figure 3A14 shows that the reduction per unit of operational stock is much less than for the domestic sector, and Figure 3A15 confirms that the impact on the national renewables balance is negligible.
Domestic heat pump technologies
An alternative (or complement) to domestic energy efficiency is the use of electrical heating for homes. This makes very little sense when electricity is generated by fossil fuels (up to two thirds of the heat content of the fuels goes up the generator chimney and one third is delivered to the home), but under a predominately renewable energy regime it might make more sense. Rather than looking at systems that convert electrical energy directly into heat, however, we chose to examine heat pump technologies, in which the heat energy generated is extracted from ambient heat gradients in the ground, and the electricity is simply used to access this rather than being the primary source of the heat.
In characterising the technology, we assumed
an average thermal efficiency of traditional
domestic heating of 80%, and a coefficient of
performance of the heat pumps of 25% (i.e. 4
units of electricity, measured in heat energy
terms, are required to transfer one unit of heat
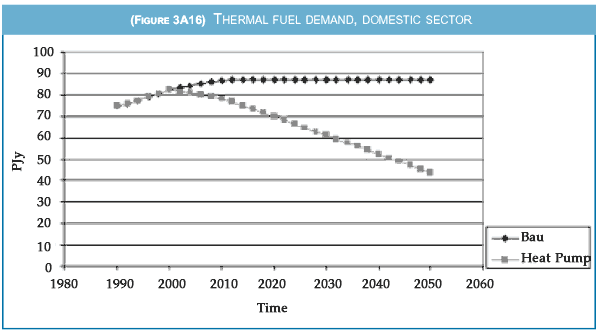
energy). The example scenario pushes the technology
quite aggressively, aiming at 10% penetration
of the housing stock by 2010, through to
a 50% penetration by 2050. Predictably, this
roughly halves the domestic sector intake of
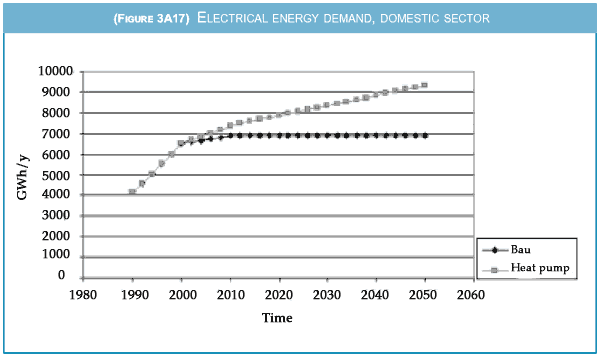
fossil fuels (Figure 3A16), and increases electricity
demand by dwellings significantly (but
not by 50%, as a large fraction of this is
required to power consumer goods of various
sorts as well) - (Figure 3A17).
 |
 |
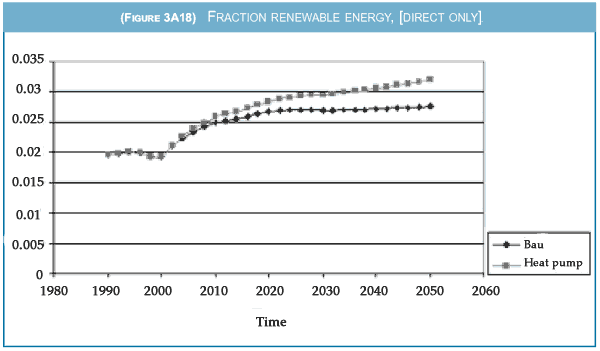
Again, we see a
mild improvement in the national renewable
energy balance (Figure 3A18), and this leads to an
increase in total renewable electricity generating
capacity of 10%.
 |
All of the above
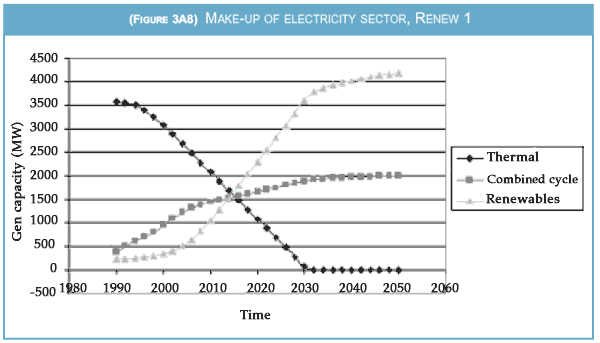
Finally, we adopted all of the above measures at once.
- A large-scale substitution of renewable electricity technologies (wind-powered), with 80% of all new generating capacity being wind.
- Large-scale transition towards electric fuel-cell road transport
- Significant investment in domestic and industrial energy conservation
- Widespread adoption of heat pump technologies for domestic heating
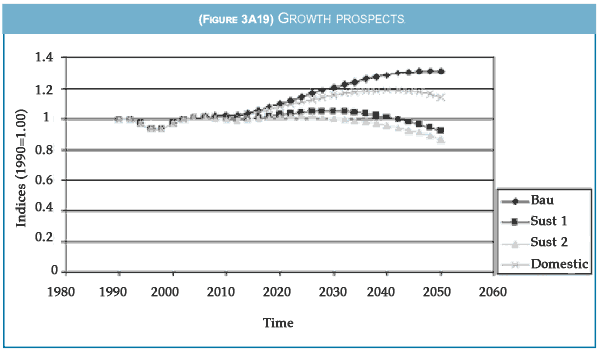
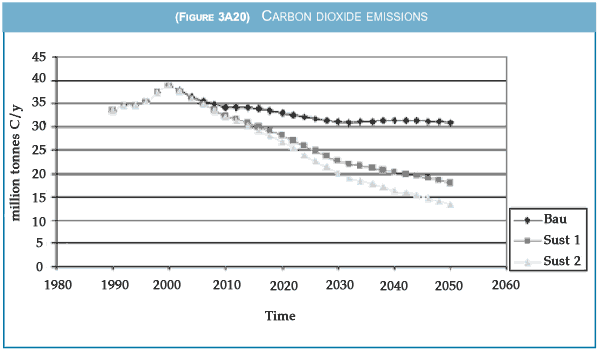
As outlined in Figure 3A8, we introduced these
both at the magnitudes already examined oneby-
one, and then finally at a greater rate, simply
in order to see how far we could achieve sustainability
by the measures we had focussed
upon.
 |
 |
 |
CONCLUSIONS
The Republic of Ireland is capable of making a transition towards sustainability over the next fifty years, owing to a plentiful supply of renewable resources and modest growth prospects. Structural factors such as the decline of current 'dirty' generating technologies, and the quick wins available from a poorly insulated housing stock, also serve to play a part.
While renewable electricity generation can play a major part in this transition, a simple approach aimed only at replacing current fossil-fuel generation of electricity with renewables will have a limited effect. A much greater effect can be had by looking for synergies with other parts of the economy, where electricity-based technologies that would simply be inefficient (in system-wide energy terms) can be brought into play. The more high-tech options considered here, such as car fuel cells and heat transfer pumps, are wasteful of fossil fuel if fed on fossil-generated electricity alone, but can become very useful in widening the circle of influence of a renewable electricity technology. The renewable electricity industry would do well to seek partnerships with developers of such technologies, in our opinion.
The technologies that we have looked at in this study are by no means exhaustive, and a more thorough cataloguing could doubtless achieve even greater gains towards sustainability than we managed in our final scenario. There are other renewable energy technologies, such as wave power, solar-power systems (perhaps less of an opportunity in the Irish climate, but still offering some potential) and biofuels, which can be represented by the ECCO methodology (and have been in other studies). There are many other technologies that may substitute fossil fuel consumption for electricity use, developing further synergies with an expanding renewables sector.
As with any modelling study, we have presented
a greatly simplified picture of a real economy,
and left out much detail. In balance of payments
terms, the economy may benefit from technical
leadership in renewable technologies, which it is
far more likely to develop through early adoption
than in the already-saturated market for
combined cycle turbines. We have not examined
in detail the land-use implications of our policies,
what the spread of wind generators across
the landscape would look like (and, were we to
consider biofuels, this would be an even more
important aspect to factor in). We have not discussed
nuclear power as an option here,
although the model is capable of representing
the shorter-term costs and benefits of that technology
at least.
This is one of almost 50
chapters and articles in the 336-page large format book, Before the Wells
Run Dry. Copies of the book are available for £9.95 from Green Books. Continue to Energy Analysis: a primer
